Analytics Suite

Analytics Suite
Analytics gives you a complete overview of how your employee advocacy program is performing. It enables you to track, measure and analyse your company metrics and data trends.
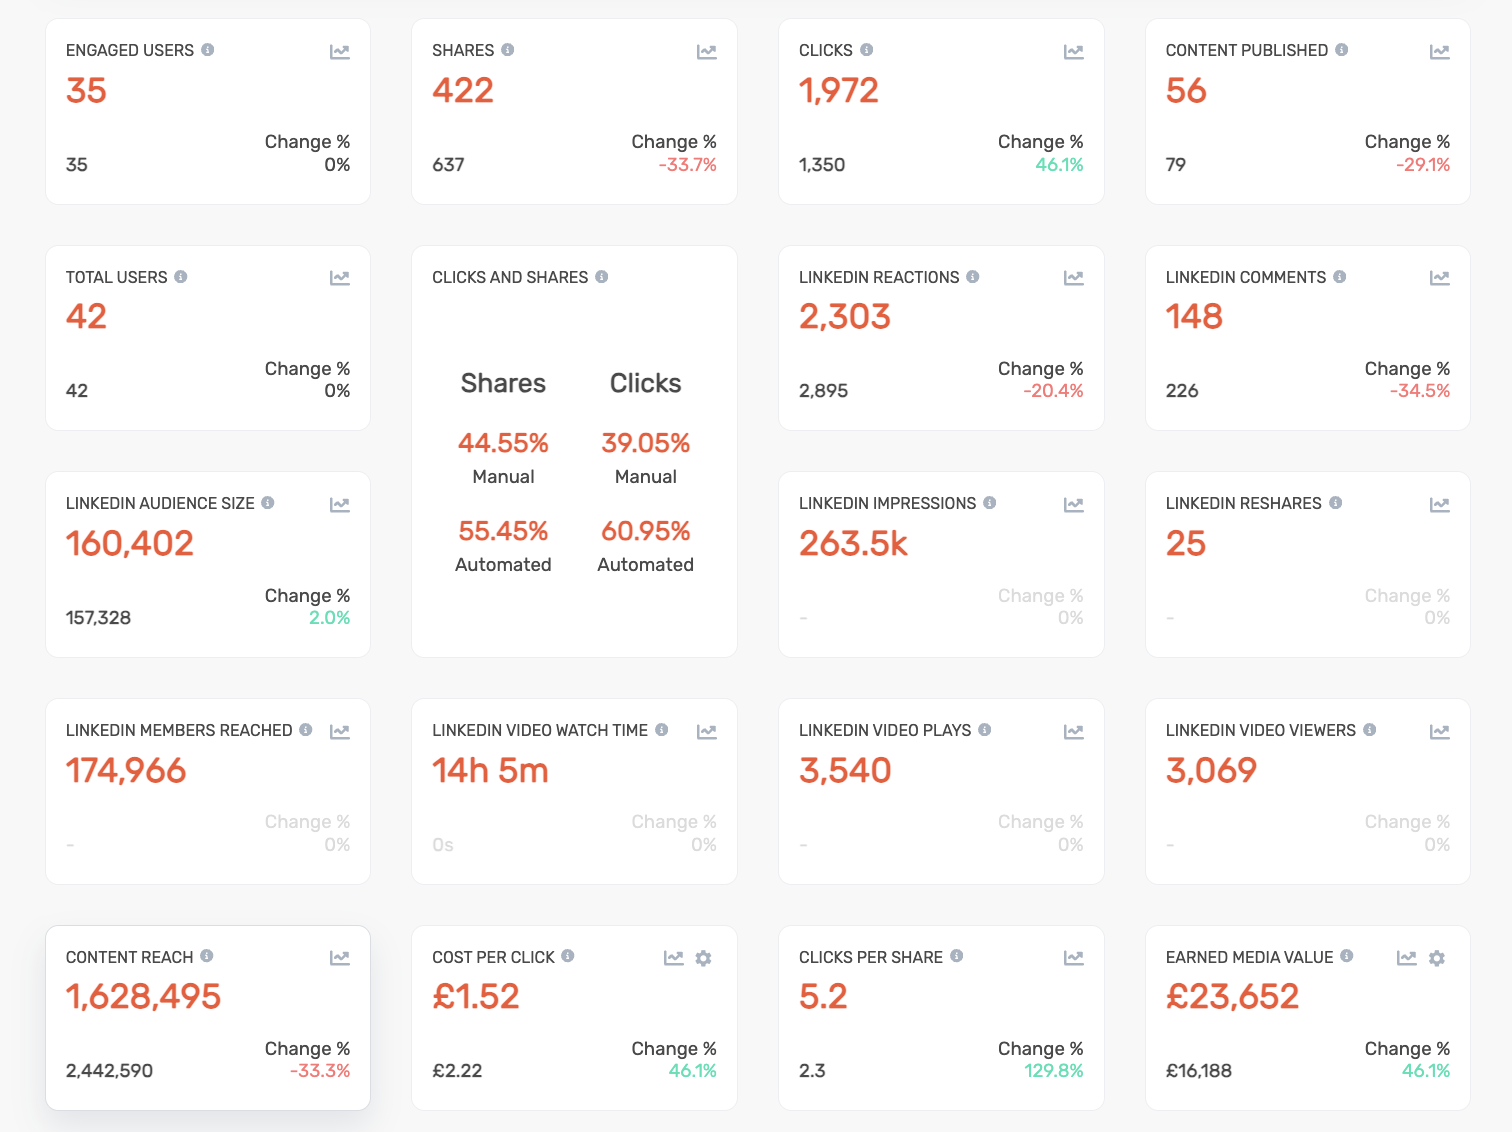
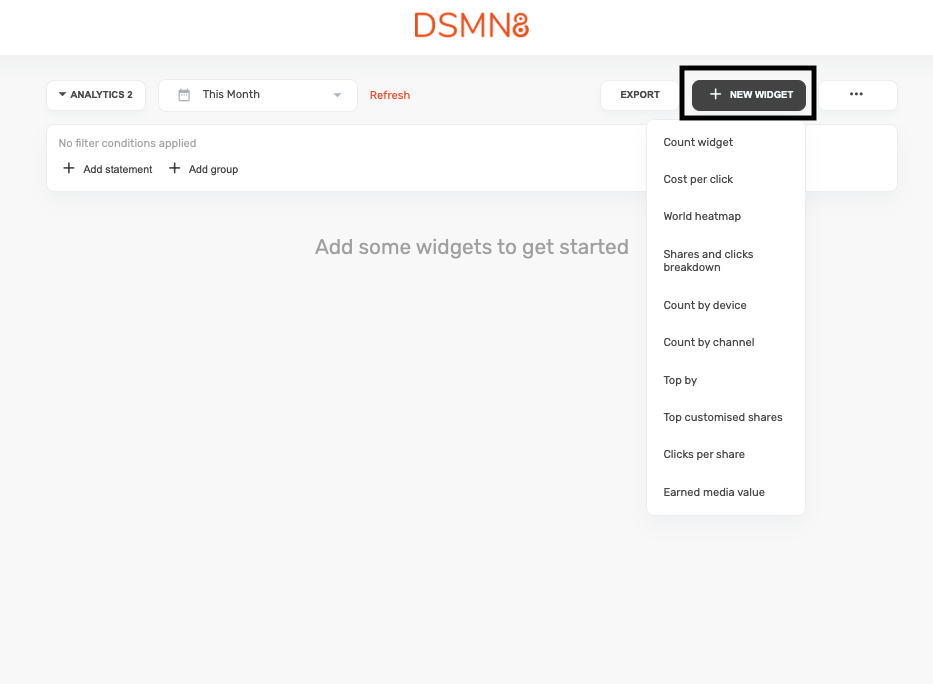
Below is an overview of the widgets within the Analytics suite.
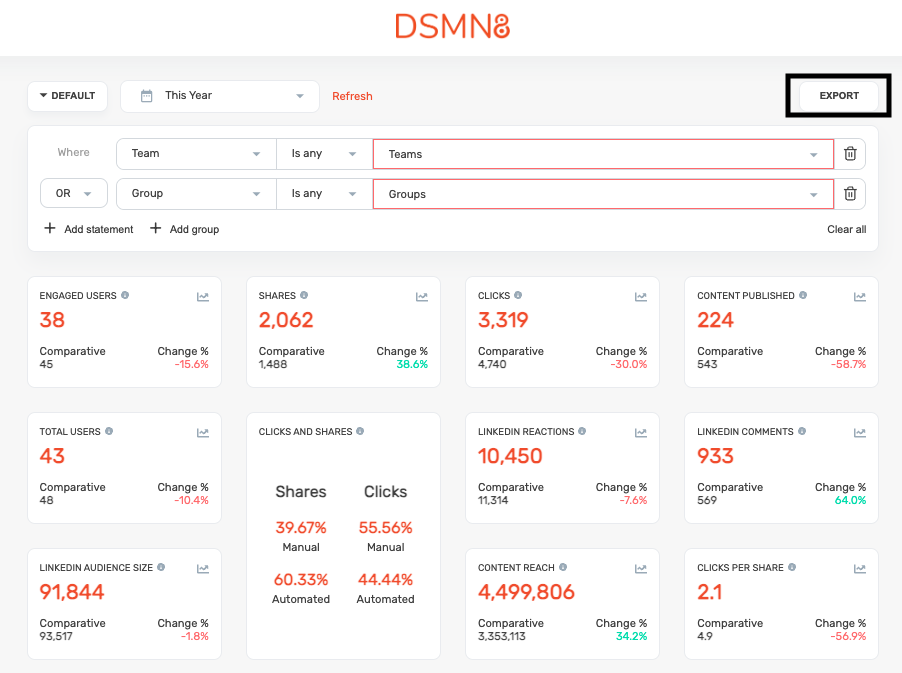
Engaged Users
The number of advocates that have logged into the platform or shared content within the specified time period.
Shares
The number of times that content has been shared by advocates within the specified time period. If a single piece of content is shared multiple times, each instance will be counted separately.
Clicks
The number of times content has been clicked after being shared by an advocate within the specified time period. Clicks only register for content with a clickable URL.
Content Published
The total amount of content added to the platform for advocates to share within the specified time period.
Total Users
The total number of advocate accounts registered in the platform within the specified time period.
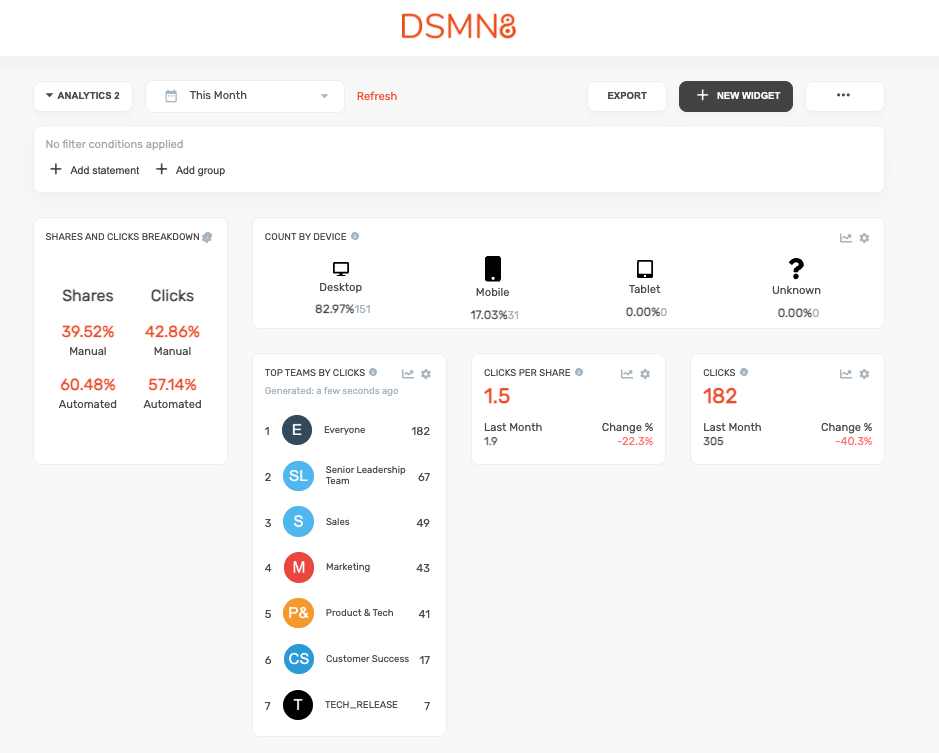
Clicks & Shares (Manual and Automated)
The percentage of manual shares and clicks Vs shares and clicks generated through advocates using the auto-scheduling tool.
LinkedIn Reactions
The total number of any reactions generated on LinkedIn within the specified time period. Please note, LinkedIn comments don't count as reactions. Reactions refer to the symbols/set of expressions that allow users to participate in conversations and communicate with their networks' posts (i.e Like, Love, Support, Celebrate, Insightful)
LinkedIn Comments
The total number of comments generated on LinkedIn within the specified time period.
Linkedin Audience Size
The collective number of LinkedIn connections of all advocates who have connected their LinkedIn account to the platform.
Content Reach
The potential reach of all content shared through the platform by registered advocates. This is calculated by multiplying the advocate audience size by the number of shares published to LinkedIn.
Clicks Per Share
The average number of clicks generated for content shared by advocates within the specified time period. Please note that clicks only register for content with a clickable URL.
Earned Media Value
This is what you would currently spend on traditional social advertising on a cost-per-click basis. It is calculated by taking the average cost per click (provided by your program leader) and multiplying this by the clicks generated per social channel. Please note, there is a default average price set across all social channels, if this hasn't been adjusted by your program leader in the metric settings.
Cost Per Click
This represents the cost of the clicks that advocates have generated against the cost of the license fee for the platform within the specified time period.
New Users
The total number of new advocates that have registered for the platform within the specified time period.
New Auto-Schedules
The total number of new auto-schedules that have been set up by advocates within the set time period.
Boosted Posts
The total number of posts that have been made available for advocates to boost within the specified time period.
Boost Post Reshares
The total number of boost post reshares made by advocates within the specified time period.
Boost Post Likes
The total number of boost post likes made by advocates within the specified time period.
Boost Post Reach
The potential reach of content that has been boosted within the specified time period. This metric is calculated by the total audience size of the advocates multiplied by the total number of likes or reshares generated through boost posts.
Clicks by Channel
The social channel that the click has been generated from after the content has been shared by advocates.
Shares by Channel
The social channels that content has been shared to by advocates.
Clicks by Device
The device that was used when a member of the advocates' social media network clicked on the URL of the shared content.
Top Teams By Shares
The teams who have shared the most content. (Please note, if a user joins more than one team their shares will be attributed across both teams).
Top Content By Shares
The published content that has been shared the most by advocates within the specified time period. The content is ranked in order of highest to lowest.
Top Content By Clicks
The published content that has generated the most clicks within the specified time period. The content is ranked in order of highest to lowest.
Top Users By Shares
The advocates that have shared the most content from the platform within the specified time period.
Top Users By Clicks
The advocates that have generated the most clicks within the specified time period.
World Heat Map
The geographical location of the clicks that have been generated from content shared by advocates.
Total Impressions
The total number of impressions generated on LinkedIn within the specified time period.
Total comments
The total number of comments generated on LinkedIn within the specified time period.
Video Plays
The total number of video plays on LinkedIn within the specified time period.
Video Viewers
The total number of unique video viewers on LinkedIn within the specified time period.
Total Watch Time
The total video watch time on LinkedIn within the specified time period.
Members Reached
The total number of unique LinkedIn members reached through advocate-shared content within the specified time period.
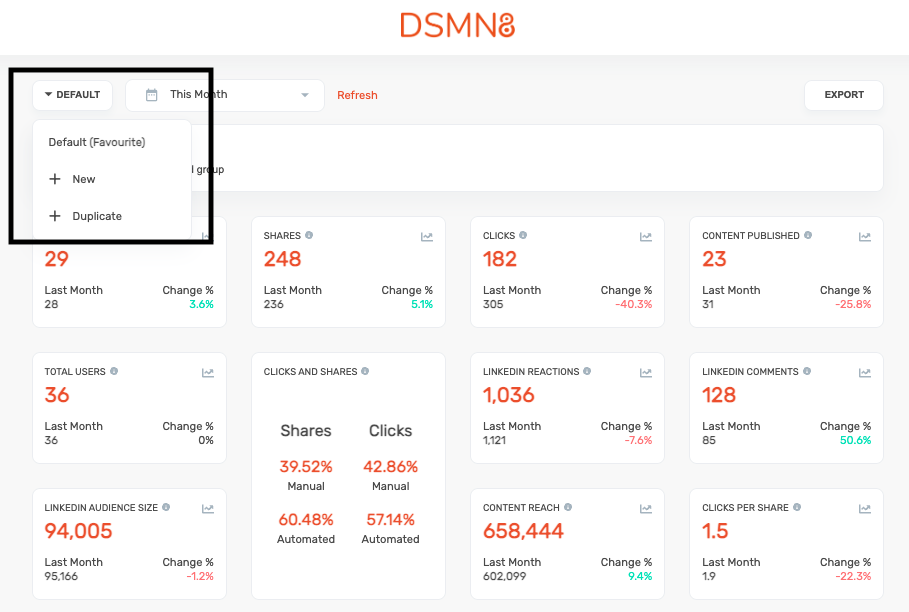
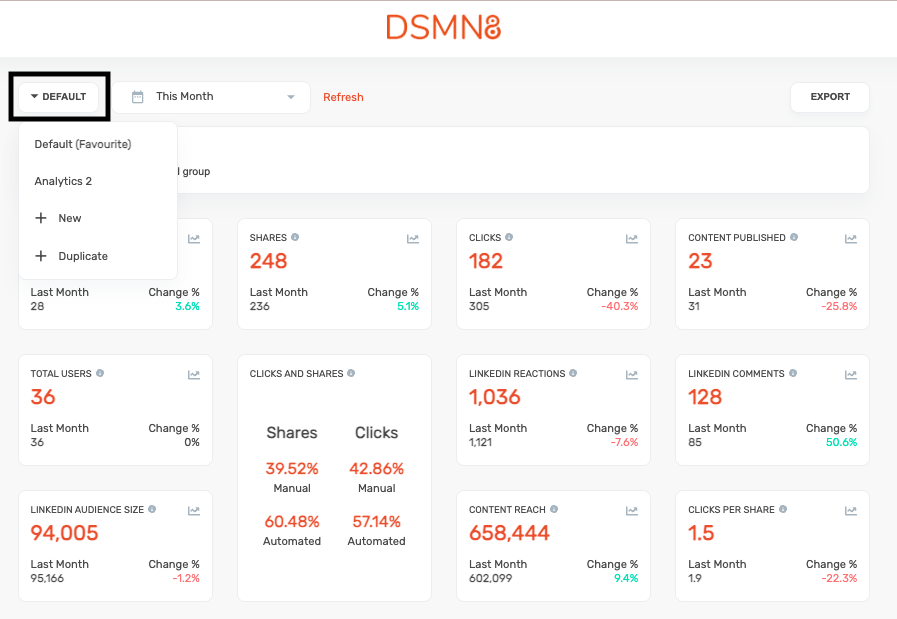
Duplicating or creating a new dashboard
Within the analytics page, you also have the ability to create a new report dashboard or duplicate another dashboard. You can do this by clicking on the default button at the top left-hand side of the page.
From there you can choose to create a new dashboard or duplicate another dashboard.
Creating A New Dashboard
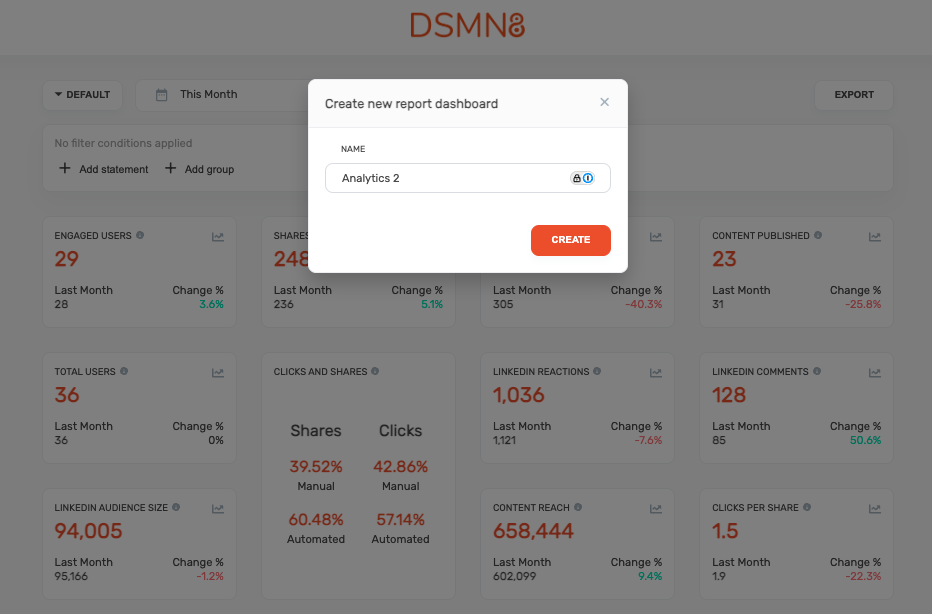
If you were looking to create a new dashboard you would click on 'new', then give your new dashboard a title.
From here you can pick and choose which widgets you would like to include within your new dashboard.
Once you have chosen which widget you would like to include within your new dashboard, you have the option to:
· Give the widget a title.
· Choose how you would like to measure the widget (by clicks, shares, social reach etc).
· Include 'custom filters', so you can target any particular teams, groups, events or campaigns.
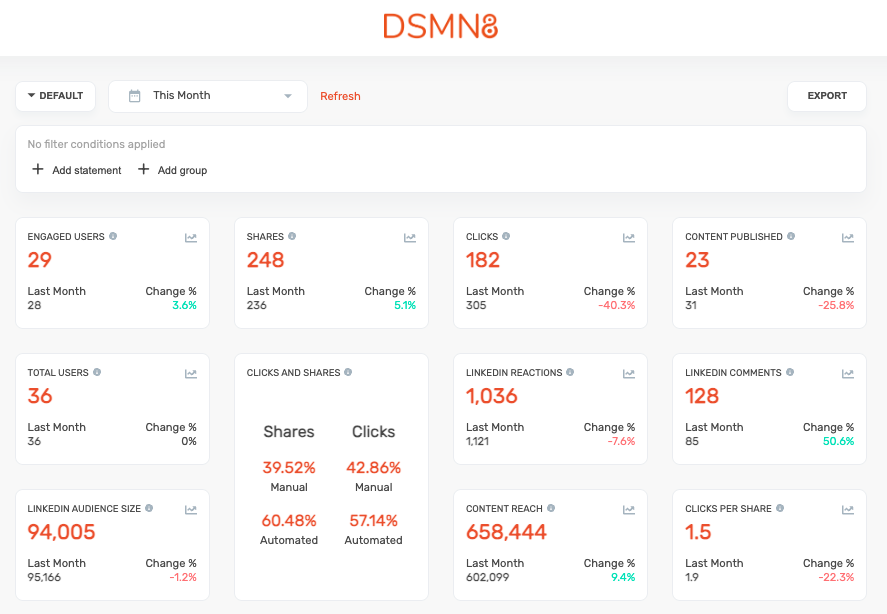
Below is an example of a new dashboard.
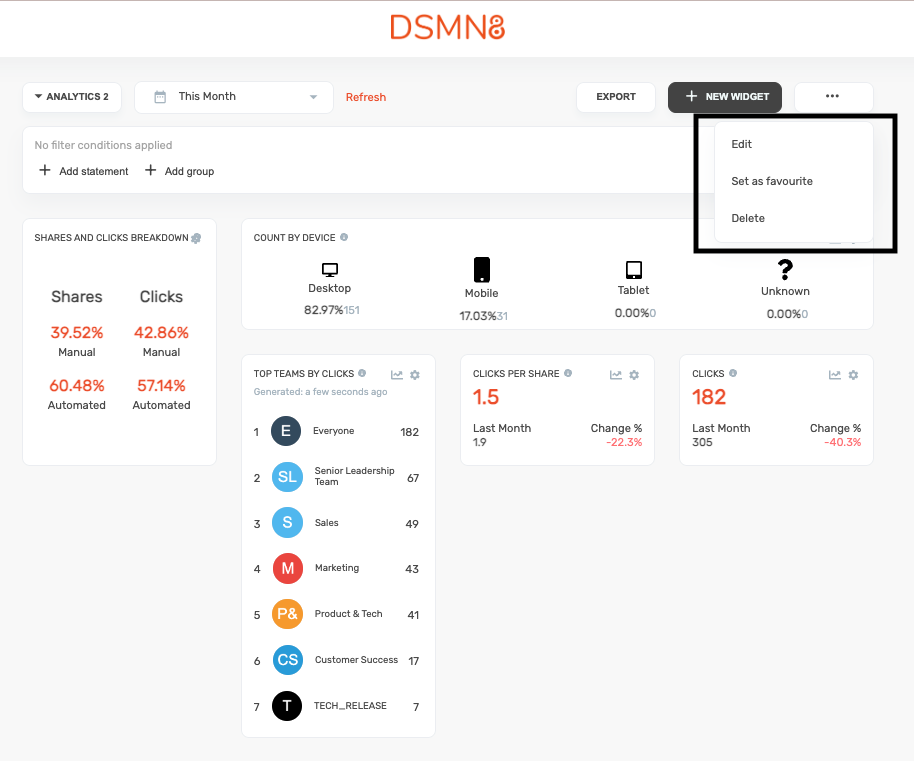
You have the ability to move the widgets, so you can choose how you would like your dashboard to be displayed. You also have the option of editing your dashboard (adding or removing widgets), setting a dashboard as a 'favourite', so that it will always show first when you open up the Analytics suite or deleting the dashboard entirely. You can do this by clicking on the three dots which can be found at the top right-hand corner of the page.
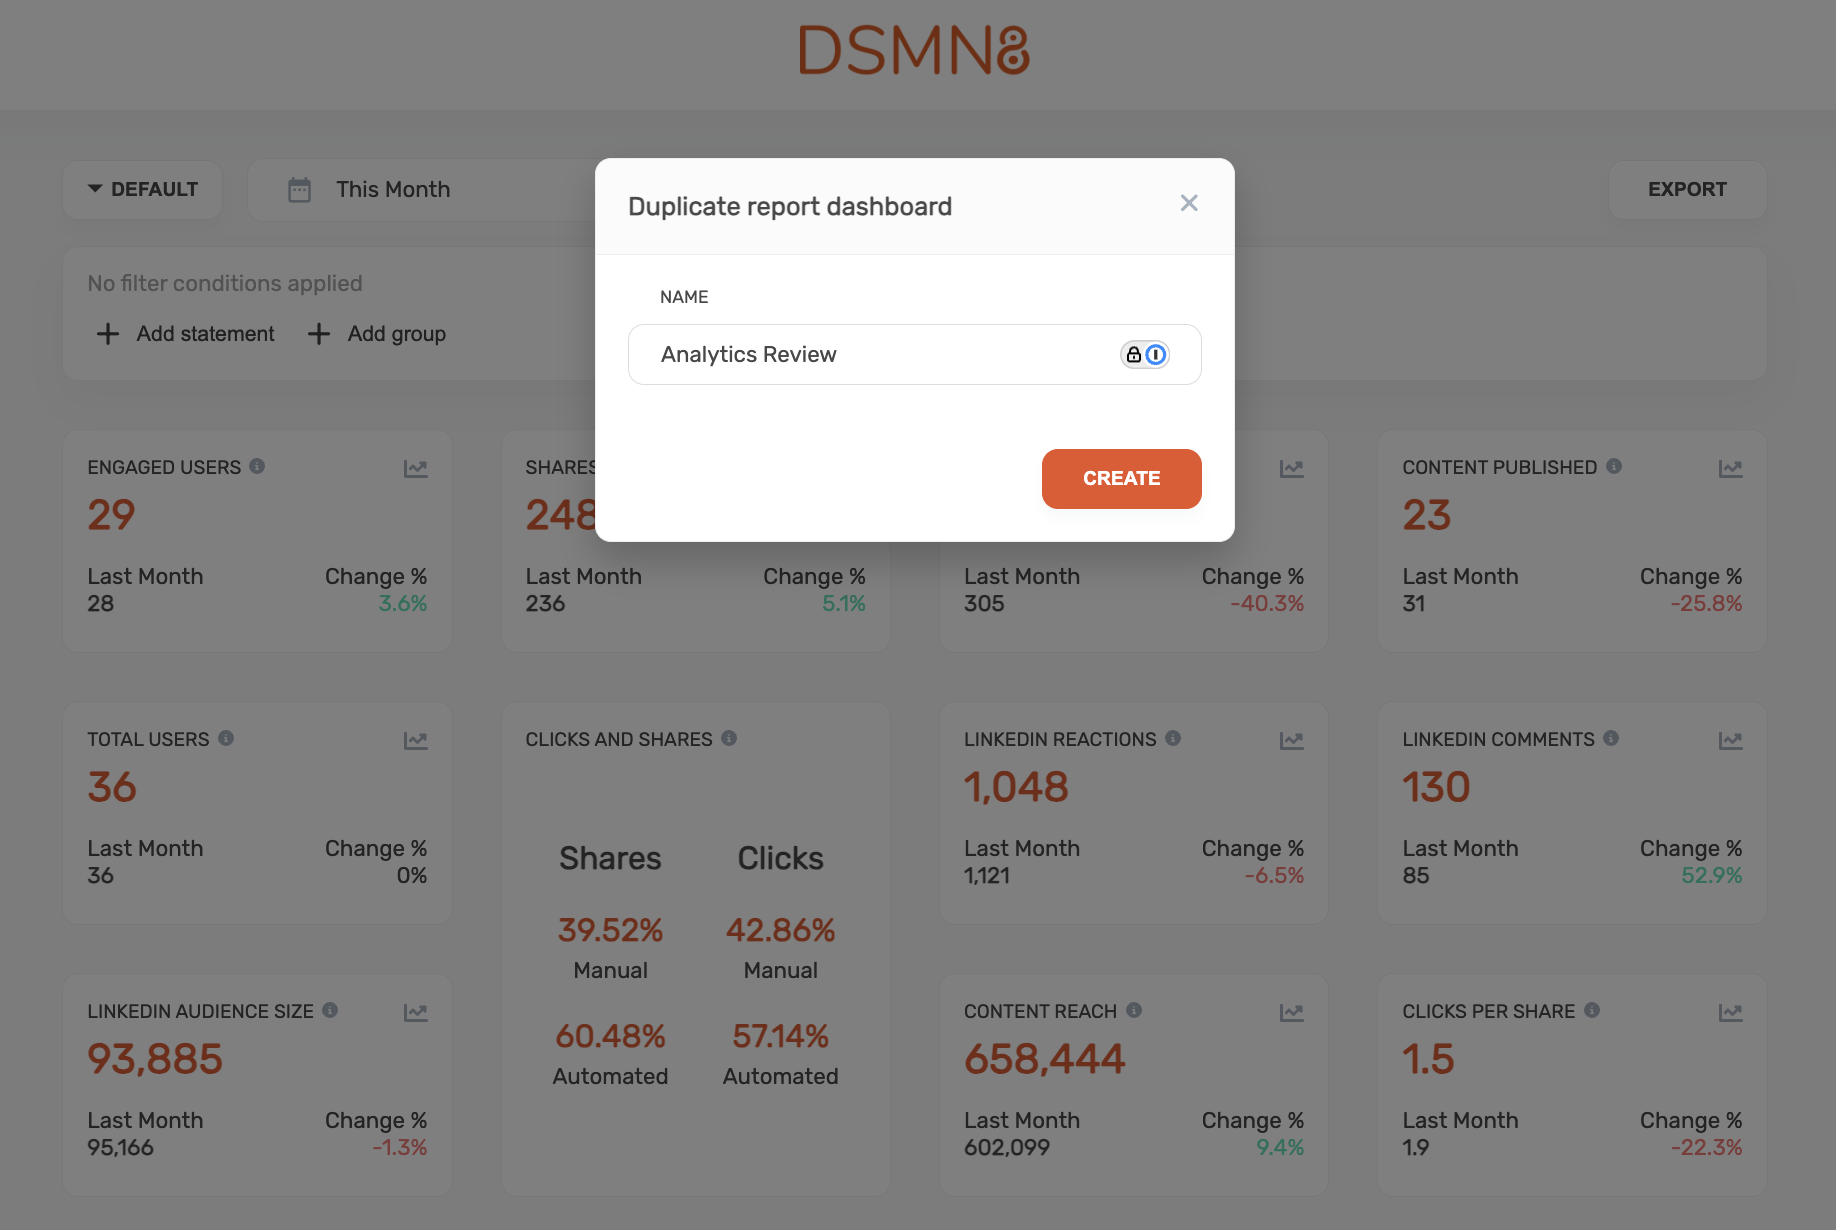
Duplicating a dashboard
To duplicate another dashboard, you would need to be on the dashboard page that you would like to duplicate. You would do this by clicking on the default button which can be found at the top left-hand side of the Analytics page.
Find which dashboard you would like to duplicate and click on it.

You would then click on the default button again, click on duplicate, give the duplicated dashboard a title, click on create and then you will be presented with the duplicated dashboard.
As previously mentioned, within the duplicated dashboard you can:
· Choose how you would like the widgets to be displayed, by moving them around the page.
· Set the dashboard as your 'favourite' so that when you open the Analytics suite, it is the first dashboard that will be viewed.
· Delete the dashboard entirely.
Filters
There are various ways of viewing the data within the Analytics suite. You can view how your employee advocacy program is performing by week, month, year etc. You can do this by clicking on 'This Month' at the top right-hand side of the page and it will give you a drop-down menu of how you would like to view your data.
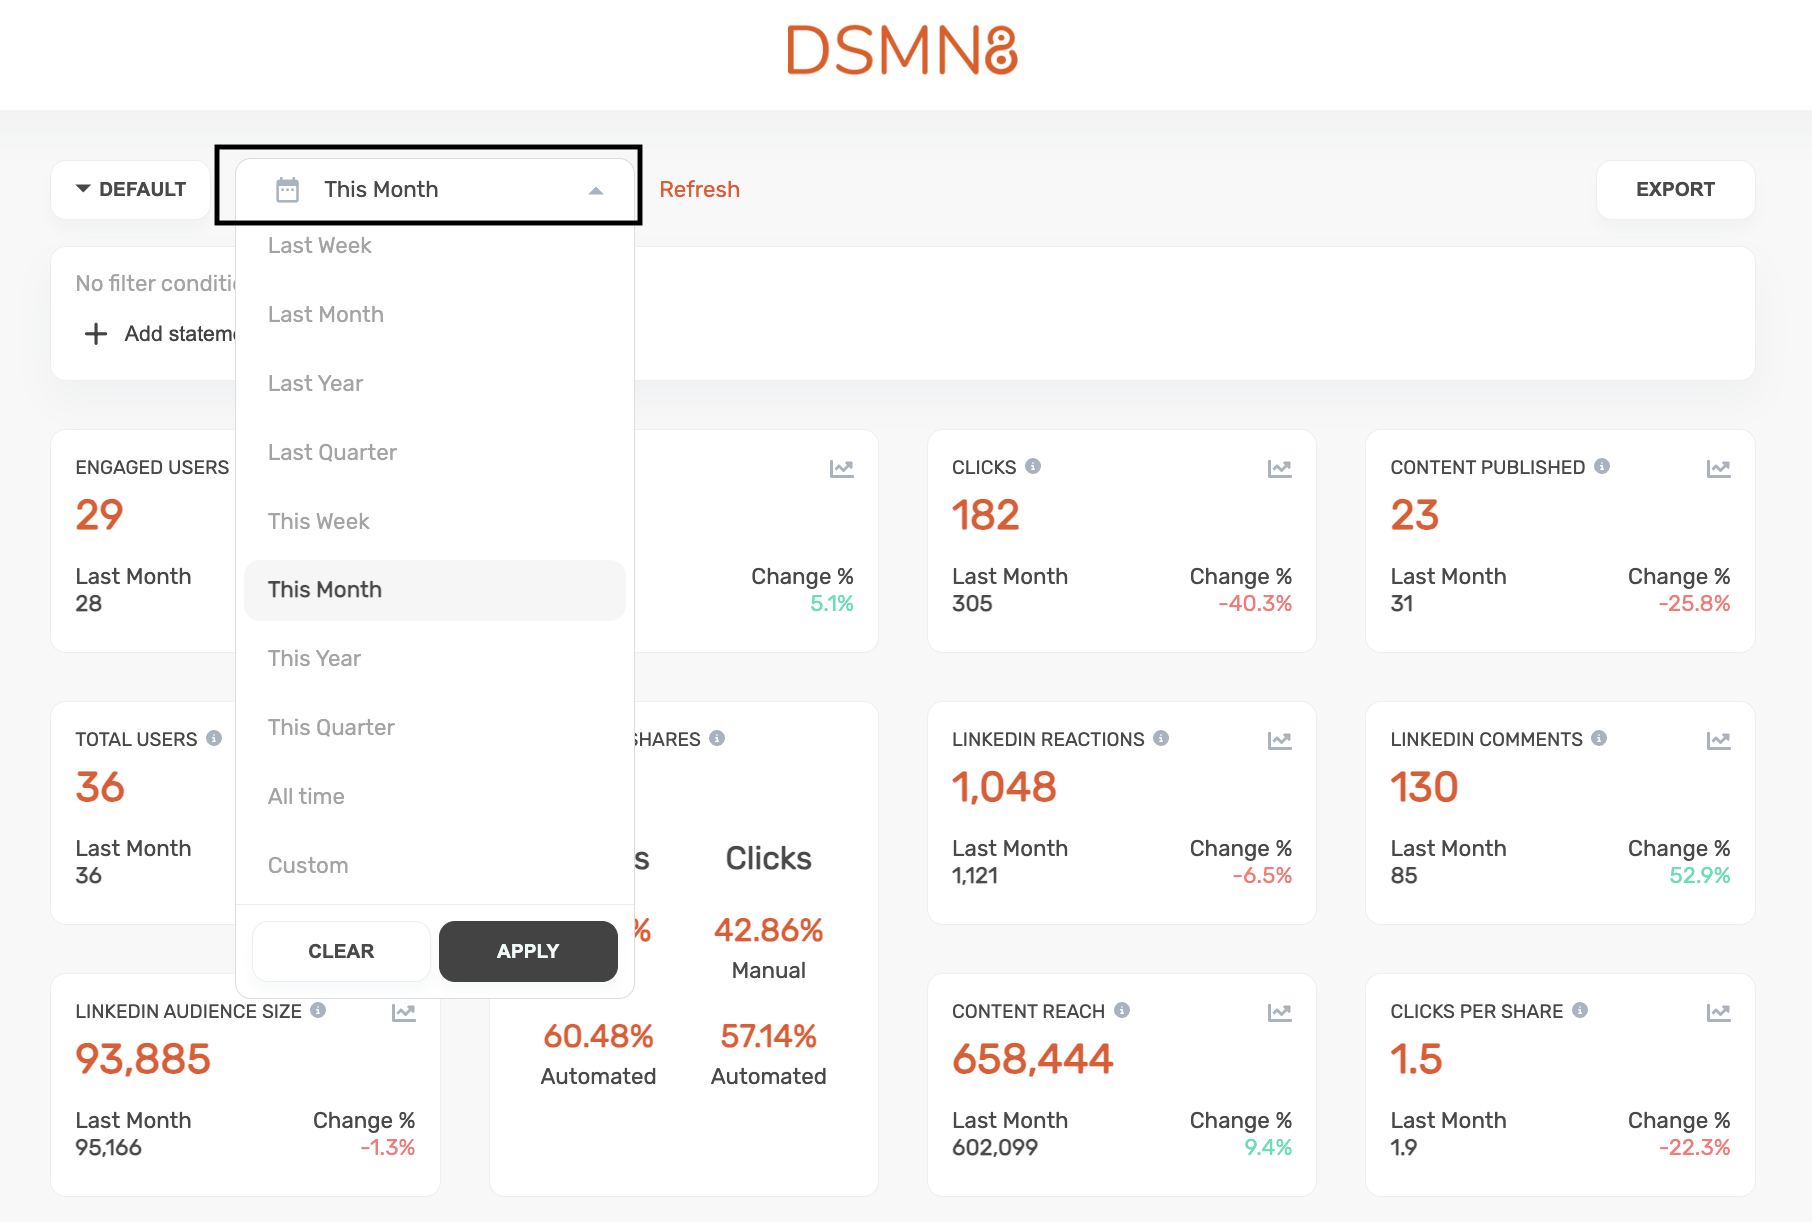
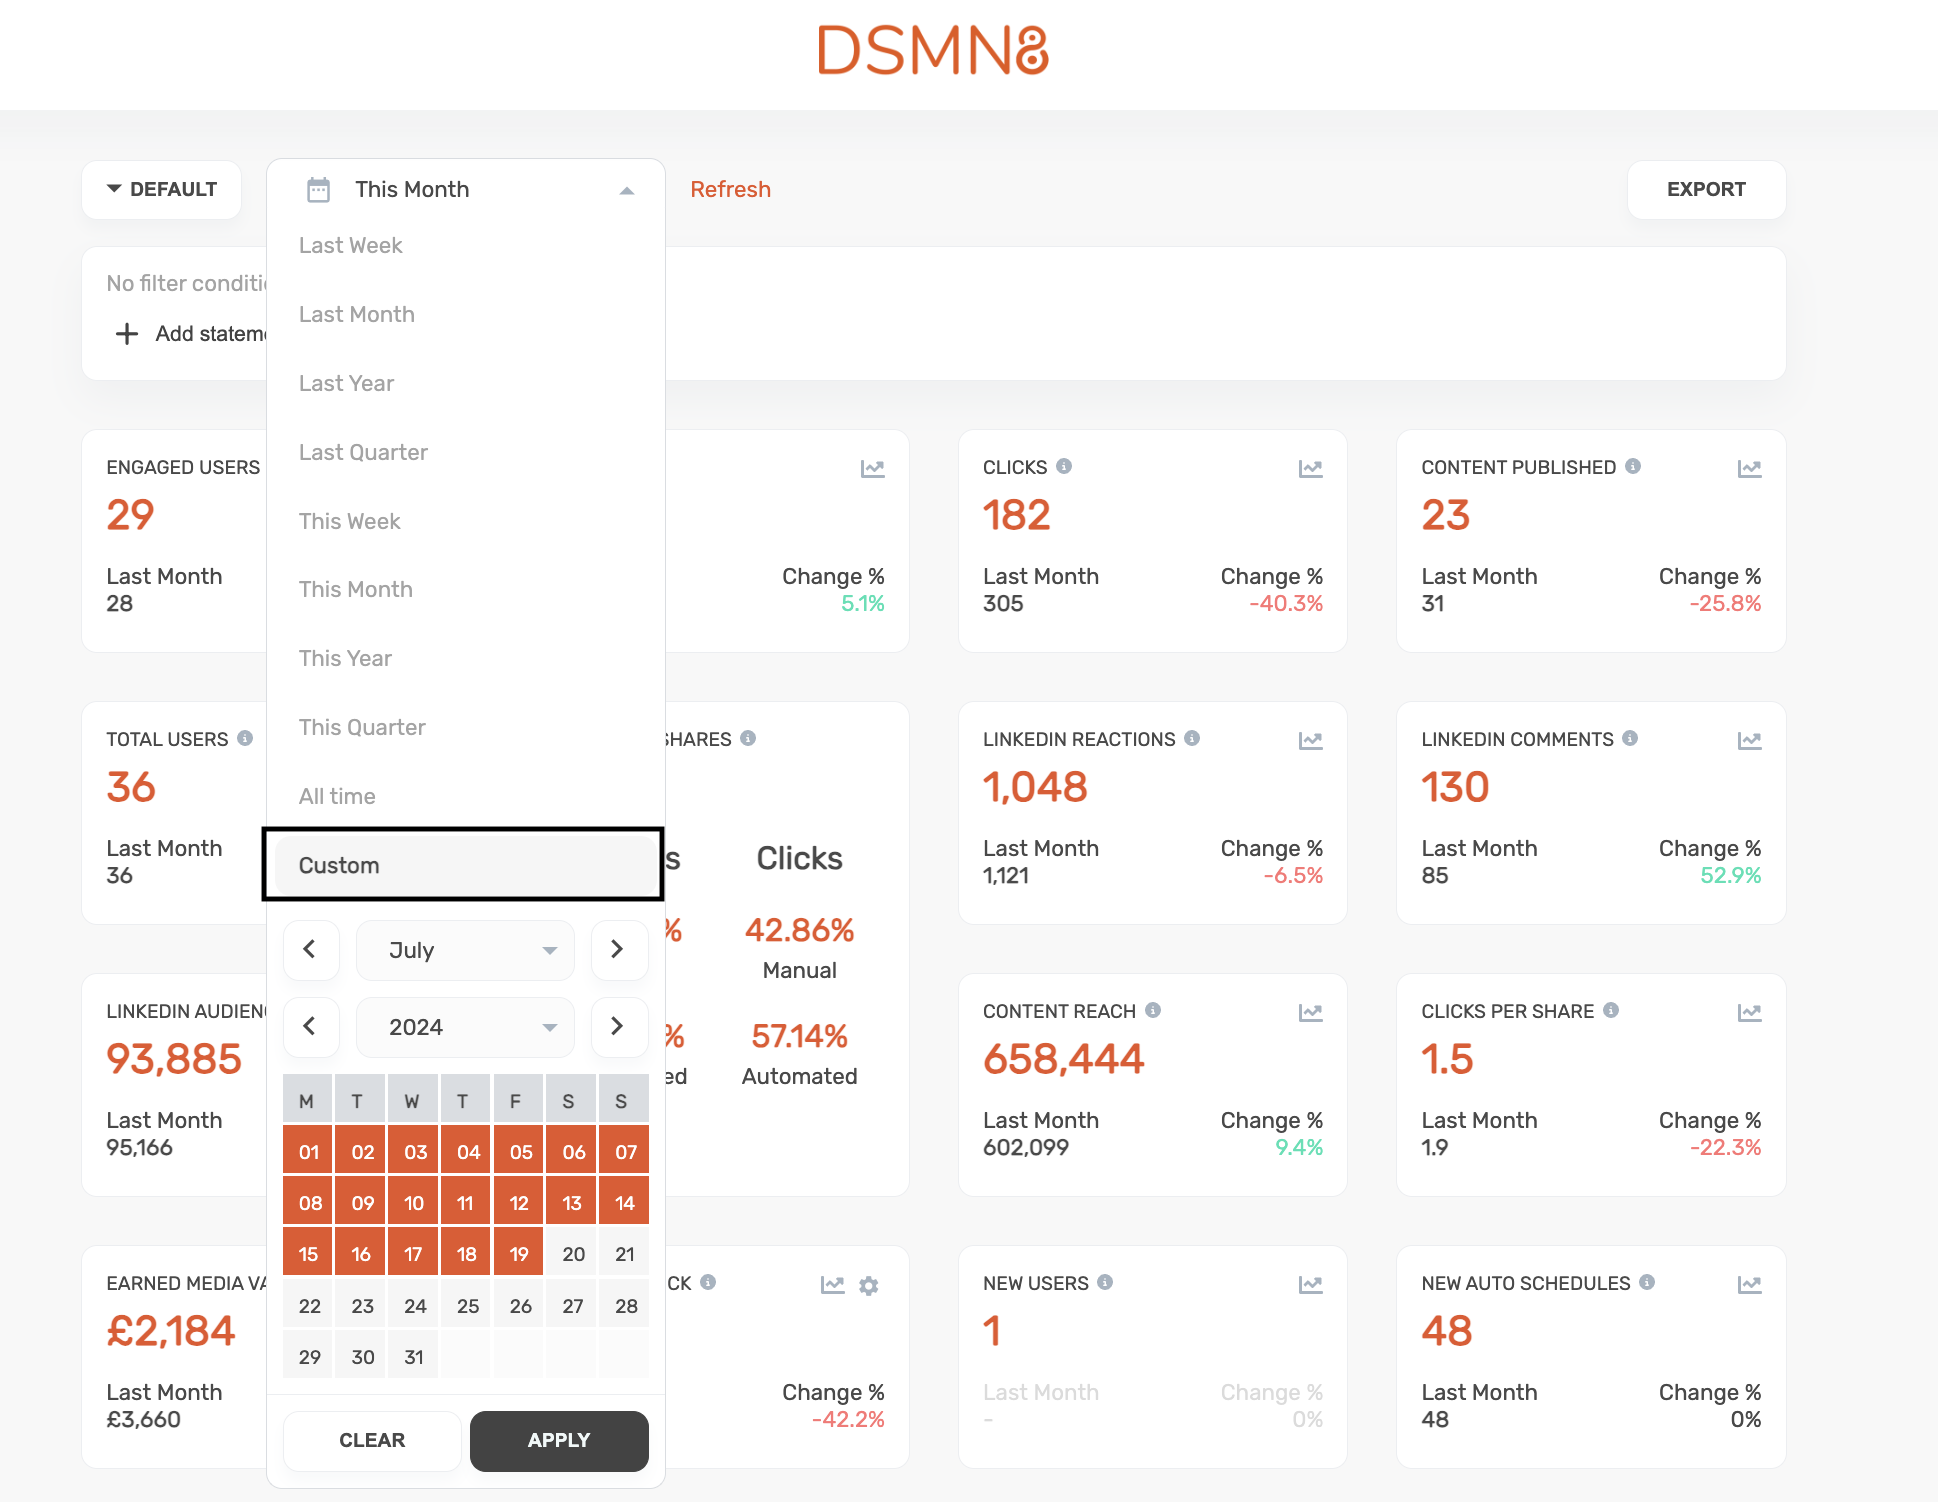
If there is a particular time scale that you would like to view, you can do this by clicking on 'Custom', choosing the month and year and then clicking on which dates you would like to view.
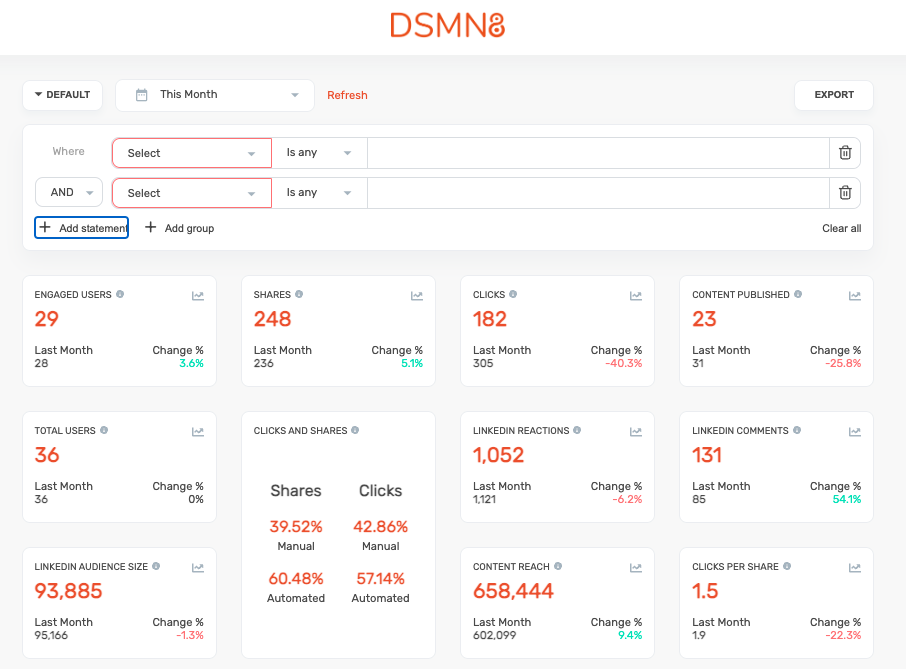
You also have the ability to view the data by teams and groups, as well as events and campaigns. You can do this by clicking on the filter button which can be found at the top of the page.
Beyond setting the date range filters, our advanced filter conditions allow you to manipulate your results however works for you, by adding 'and/or' statements to generate your desired snapshot.
Dashboard Exports
Once you have applied the desired set of conditions to filter the data, you may want to export the snapshot to Excel. You can do this using the 'Export' button at the top right of the screen to generate an Excel file with all active filter preferences applied. As with the Dashboard, this provides an aggregate snapshot of the data in real-time.
Raw Data Exports
For users looking to run much more granular reporting or perhaps are looking to join these datasets with other sources, you're also able to export the raw data for Users, Shares and Posts.
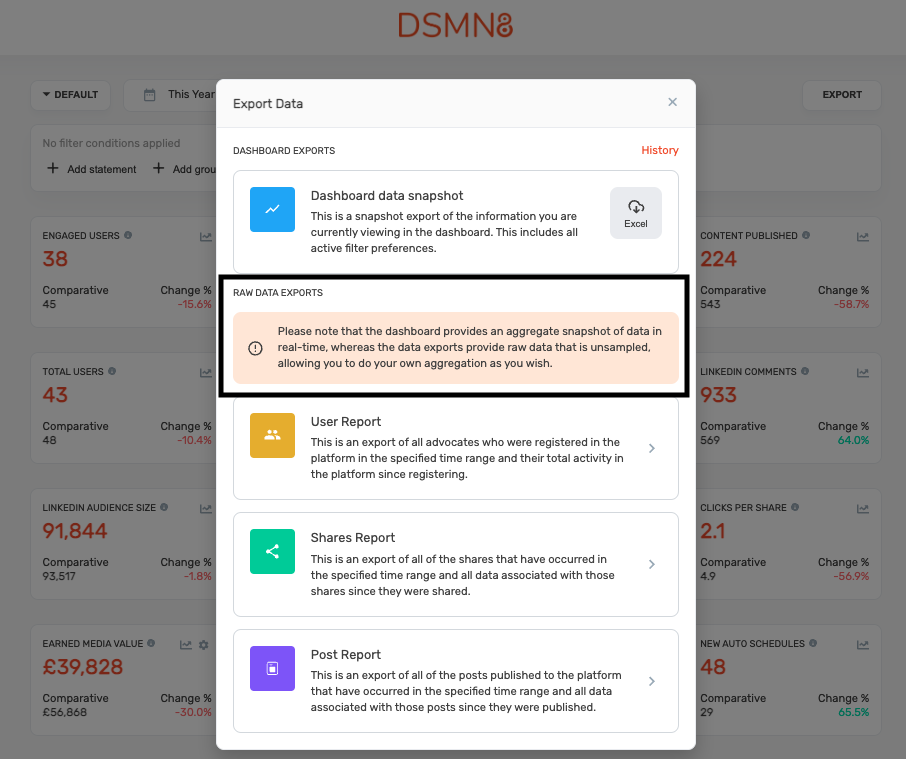
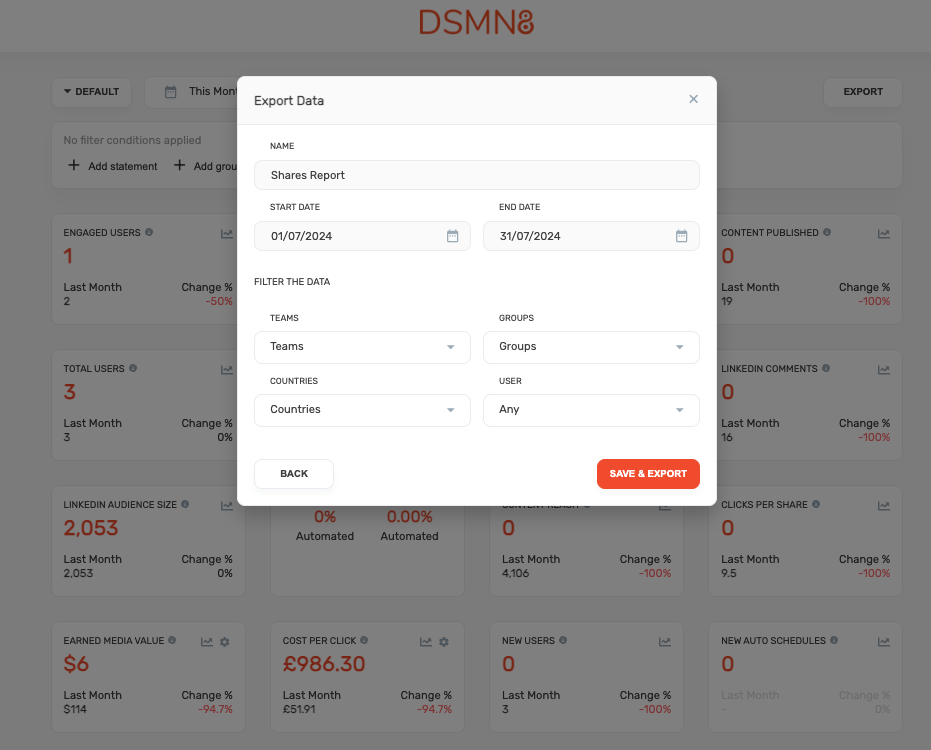
Once you have selected which report you'd like to export, you'll be able to give your report a name, set time parameters, and filter the data by Teams, Groups, Countries or Users should you wish to.
User Report
An export of all advocates who were registered in the platform in the specified time range and their total activity in the platform since registering.
Shares Report
An export of the shares that have occurred in the specified time range and all data associated with those shares since they were shared.
Posts Report
An export of all posts published to the platform that have occurred within the specified time range and all data associated with those posts since they were published.