Video Training Series
Admin Video Training
Content Sources & Pending Content (Video)
Suggesting Content (Video)
Global Settings (Video)
Internal Posts (Video)
Product Portal & Assistance (Video)
Personalization (Video)
Personal Analytics (Video)
Gamification Settings (Video)
Vanity URLs (Video)
Inviting Users (Video)
Boosting Posts (Video)
Teams and Groups (Video)
Curating Content For Employees
Pinning content (Video)
Engaging with colleagues' posts (Video)
Advocacy Tools (Video)
Getting Started With DSMN8: Training Guide Overview
FAQs
Why are images not loading on our website/app or on LinkedIn posts?
Is Employee Advocacy Right for Your Company? A Guide for Smaller Teams
How can I delete my DSMN8 account?
How do I find/search content?
Can I approve Team Leader or Curators posts before the content is published?
Why is my post private?
Is UTM Tracking added to posts?
Which types of content can be added to the platform?
How do I tag colleagues or companies?
What is a content source and how do I add one?
How do I delete content?
What is the difference between Admins, Team Leaders and Curators?
Can I boost posts from my Senior Leaders' LinkedIn accounts?
What is the difference between Teams and Groups?
Which types of content should I add to the platform?
Where is my DSMN8 registration code?
Why is my reset password email not coming through?
Why is my mobile app crashing?
Can I use auto scheduling in other social media platforms other than LinkedIn?
Why am I seeing different content in my feed compared to my colleagues?
Can I write a post for my colleagues to share?
Why is my comment or like on the post in the DSMN8 feed not showing on LinkedIn?
Latest Updates
Content Feed & Filters
Document Posts: Share PDFs, Word Docs, and PowerPoints Directly on Your Posts
X (Previously known asTwitter) Update
Expired Posts
Published Content
New Curation Update
Admins
Inviting Users & Registration Settings
Inviting Users
Domain Approval
User Approval Workflow
Onboarding Message for Teams
Custom Terms & Conditions
Gamification
User, Team & Group Management
Executive Influencers (VIPs)
Adding Teams
Restricted Access Teams
Adding Groups
Admins, Curators & Team Leaders
Mandatory Groups
Global Settings
Personal Post Settings
Share Limits Setting
Time & Region Settings
Sharing Hours
Maximum Teams
Social Settings
Global Notification Settings
Personalisation
Invite a Colleague
Newsletters
Newsletter Settings
Creating & Sending Newsletters
Newsletter Overview
Newsletter Templates Library
Newletter Analytics
Newsletter Elements
Curating Content
Video Frame Selection for Thumbnails
Curating Images
AI Assistant
Curating Link Content
Video Curation
Tagging Companies & Users in Post Captions
Curating LinkedIn Video
Personal Posts (Admin Information)
Internal Posts
Deleting Content
Boosting Posts
Draft Content
Integrations
Creating Content Sources
Adding X (Previously known as Twitter) As A Content Source
Adding Youtube As A Content Source
Adding Facebook As A Content Source
Adding LinkedIn As A Content Source
Adding An RSS Feed As A Content Source
Analytics
Company Voice Guide - AI Feature
Users
Sharing to LinkedIn
Points
Notifications Explained
Teams
Personal Posts
Sharing To X (Previously Known As Twitter)
Sharing to Facebook
LinkedIn Permissions
Connect Your LinkedIn
Smart Schedule Algorithm
Auto-Scheduling
Groups
Suggesting Content
Sharing To Other Apps
Sharing To Instagram
Claimable Rewards
Leaderboard Rewards
User Analytics
Leaderboard
- All Categories
- Users
- User Analytics
User Analytics

User Analytics
Find out more about the results you have achieved with your personal user analytics. See where you rank across the company for Points, Shares and Clicks.
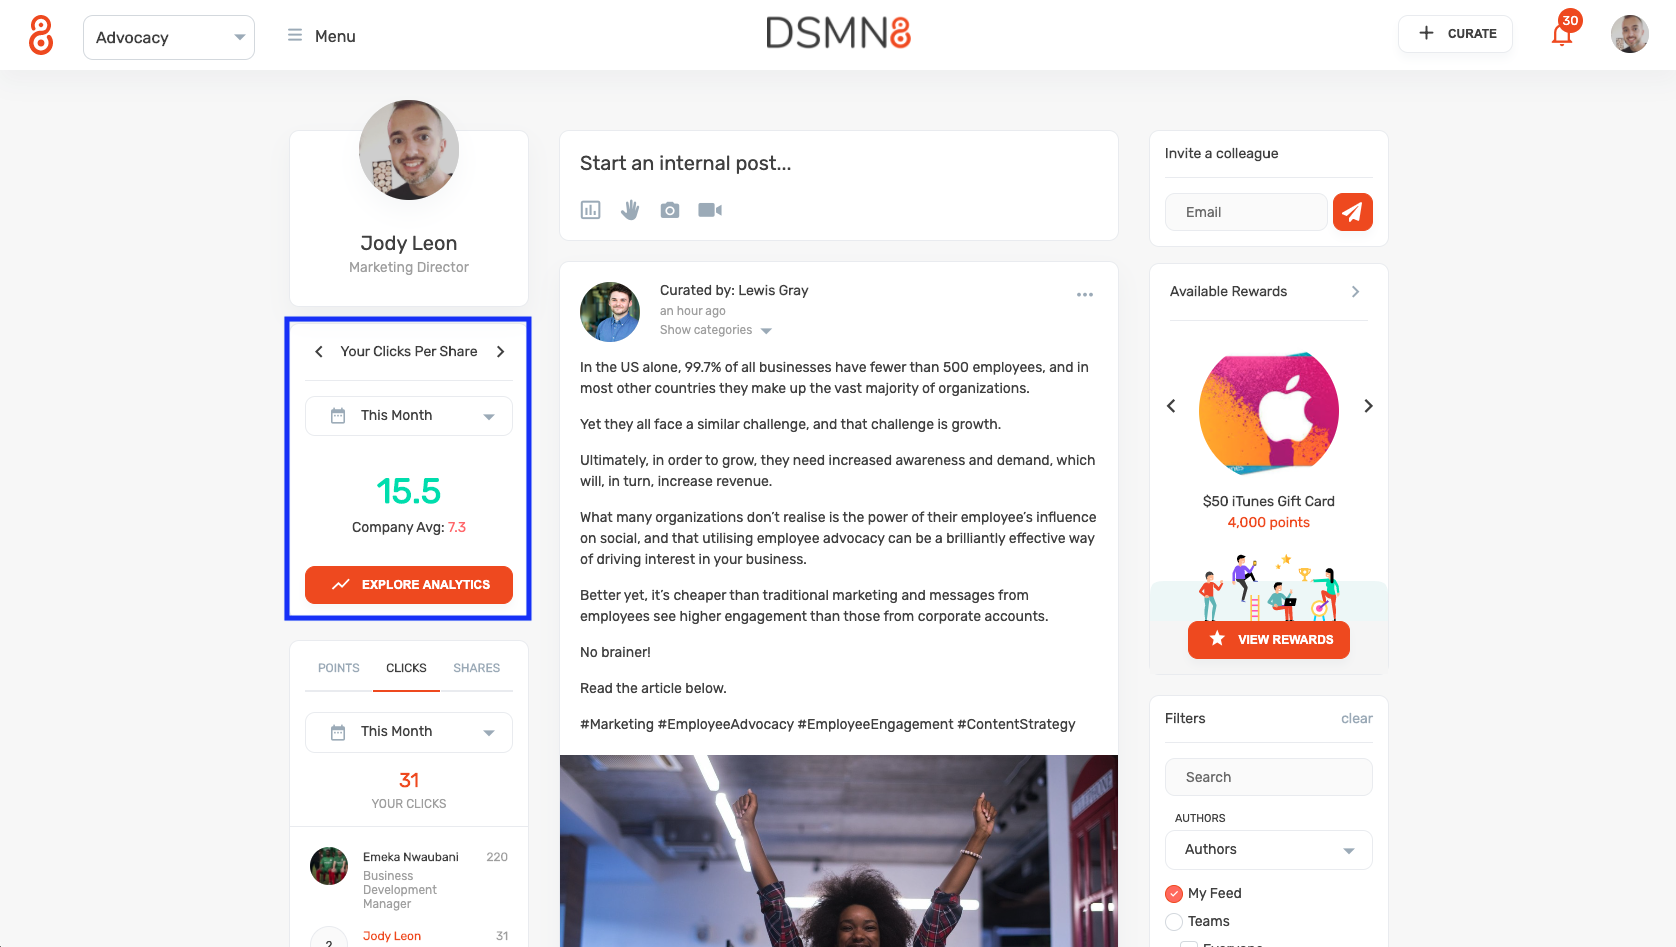
Press Explore Analytics for a more detailed breakdown of your results within DSMN8.
Find out how many shares and clicks you have generated as well and use our click map to see where in the world people are engaging with your content. You can also view your most popular shares among other stats.
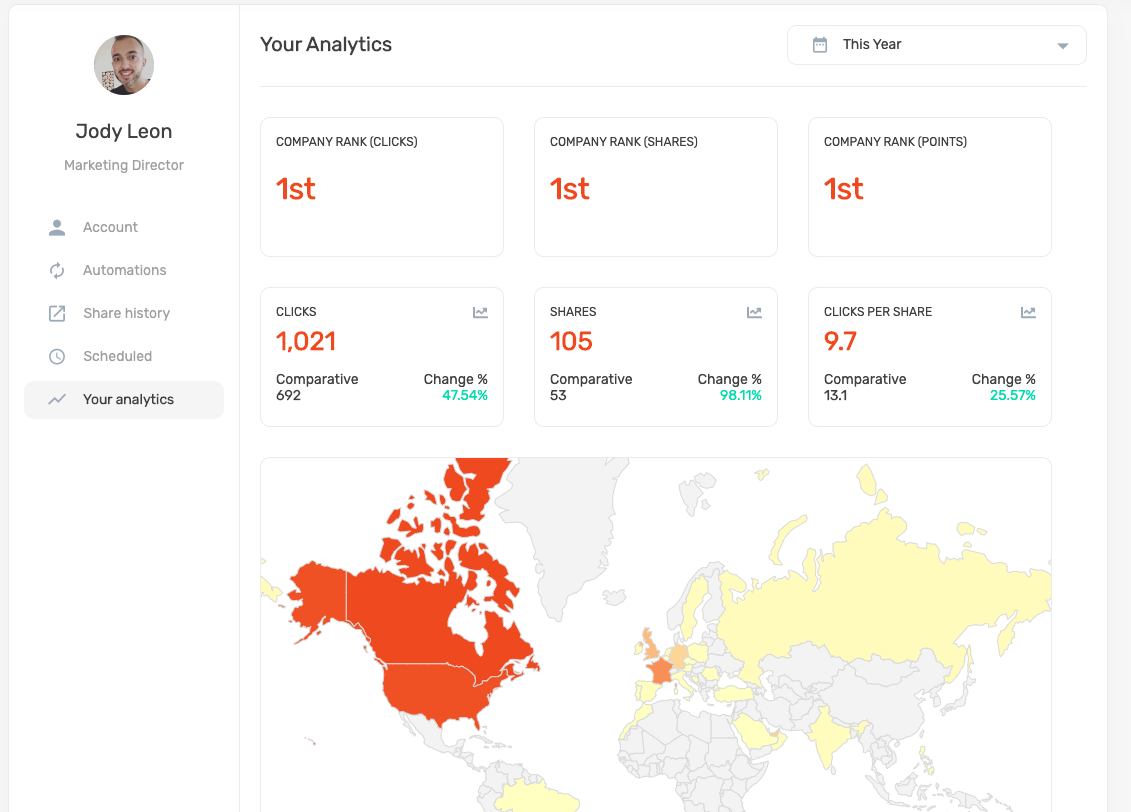
Below is an overview of the widgets within your Analytics suite.
Shares
The number of posts that you have shared.
Clicks
The number of times someone clicks on the content that you have shared on social media. (IE User X has shared an article to LinkedIn and Person Y from has clicked on the article they shared.)
Clicks Per Share
The average number of clicks generated every time a post is shared.
LinkedIn Reactions
The number of LinkedIn users who have reacted to content that has been posted through DSMN8.
LinkedIn Comments
The number of comments to the content that has been posted through DSMN8.
Linkedin Reach
The number of times that the content has been seen by LinkedIn users on their feed.
Clicks By Country
An overview of how far your content is reaching around the world. You are able to view the clicks by country, by hovering your cursor over each country.
Clicks By Channel
A breakdown of clicks by the social media channel that they have come from.
Shares By Channel
A breakdown of each social media channel showing where your content has been shared.
Clicks By Device
The device you have shared your content from.
Top Content By Clicks
The content that has generated the most amount of clicks on social media.
Clicks & Shares (Manual and Automated)
The percentage of clicks and shares from manual and automated sharing.
Filters
There are various ways of viewing the data within your Analytics suite. You can view your results by week, month, year etc. You can do this by clicking on 'This Month' at the top right-hand side of the page and it will give you a drop-down menu of how you would like to view your data.
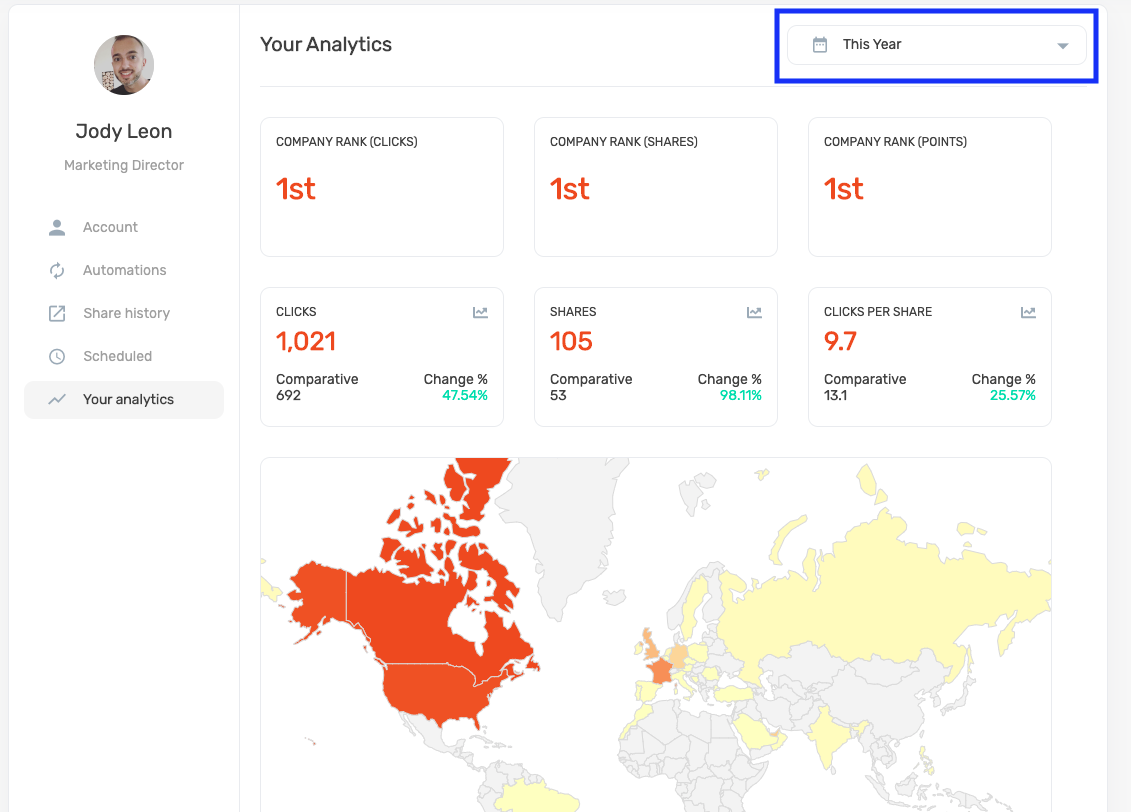
If there is a particular time scale that you would like to view, you can do this by clicking on 'Custom', choosing the month and year and then clicking on which dates you would like to view.